INTRODUCTION
This month, March of 2020, is an important month as it represents the last month of pre-Covid-19 market results. This will become the threshold from which future months will be measured to evaluate the pandemic impact. It can certainly be expected that April, 2020 will show a large change in the quantities of transactions. The real bell weather though, will be how March 2020 will compare to activity a few months after the new normal is established.
Just the meat? Here you go…
- Units sold UP1% from March ’19
- Units sold YTD (Year to Date) UP 28.6% from March ’19
- Average home price UP 6% from March ’19
- Total value of units sold UP5% from March ’19
Grey Bruce Owen Sound home sales up year-over-year in March
Residential sales activity in the geographical area covered by the REALTORS® Association of Grey Bruce Owen Sound totalled 211 units in March 2020. This was an increase of 24.1% from March 2019. Included is this region are our areas of Kincardine, Huron-Kinloss and Saugeen Shores.
On a year-to-date basis, home sales totalled 540 units over the first three months of the year. This was an increase of 28.6% from the same period in 2019.
The average price of homes sold in March 2020 was a record $445,569, rising 26.3% from March 2019.
The more comprehensive year-to-date average price was $422,913, rising 19.6% from the first three months of 2019.
New residential listings in the region numbered 343 units in March 2020. This was an increase of 12.5% on a year-over-year basis.
Overall supply remains near record lows. Active residential listings numbered 674 units at the end of March. This was down 5.5% from the end of March 2019.
Months of inventory numbered 3.2 at the end of March 2020, down from the 4.2 months recorded at the end of March 2019 but below the long-run average of 7.5 months for this time of year. The number of months of inventory is the number of months it would take to sell current inventories at the current rate of sales activity.
The dollar value of all home sales in March 2020 was $94 million, a large increase of 56
.8% from the same month in 2019. This was also a new record for the month of March.
Sales of all property types numbered 247 units in March 2020, up 6.5% (15 sales) from March 2019. The total value of all properties sold was $107.7 million, a large increase of 33.5% from March 2019.
To learn more, contact Morrison MacKenzie at 519-389-7153, mo@momackenzie.com, or https://momackenzie.com
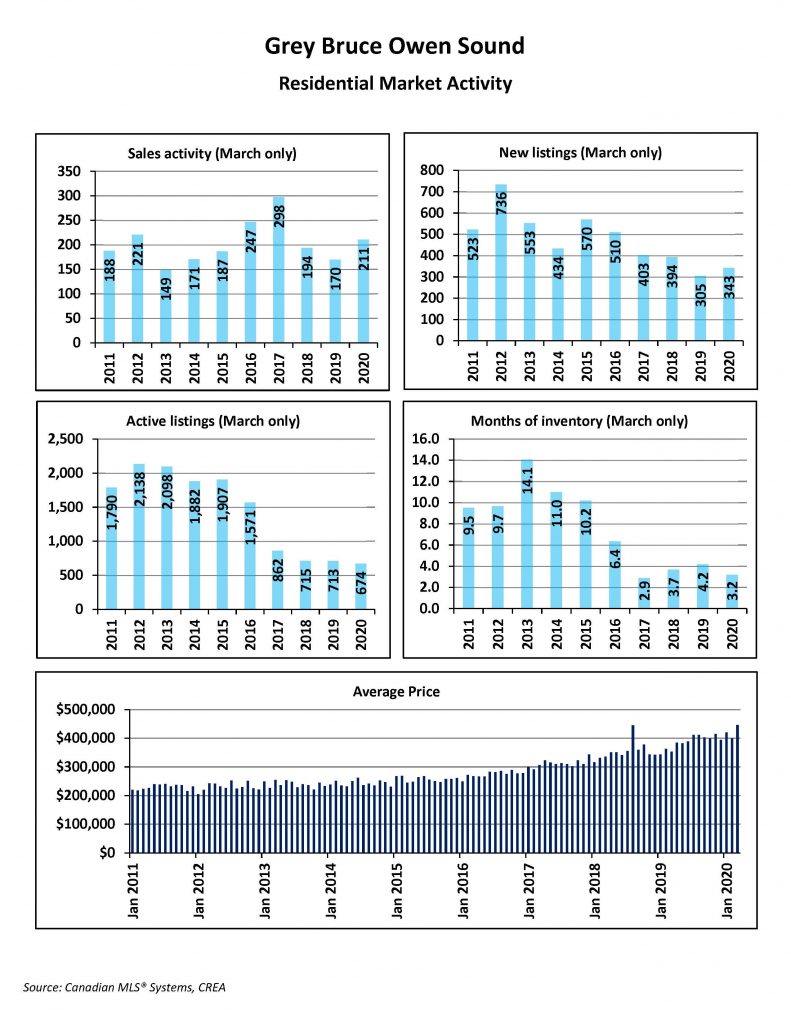
This series of graphs help visualize the month of March 2020 Residential Real Estate Market Activities as measured by the number of homes sold, new listings, active listings, the Months of inventory and the average price. They have been compiled by our local Real Estate Board and compare the info as it relates to the past 10 years.
What do they tell us?
1- the low supply and high demand situation has continued accelerating in the Grey Bruce Owen Sound market area.
2- New and Active Listings CONTINUED their trend to fewer and fewer listings (lower and lower supply)
3- Months of Inventory is very low. Typically, a market that favours sellers has less than 6 months of supply, while more than 6 months of supply indicates an excess of homes for sale that favours buyers. The current trend in Grey Bruce has been around the three month range for some time.
Months of Inventory is defined as the measure of how many months it would take for the current inventory of homes on the market to sell, given the current pace of home sales. For example, if there are 50 homes on the market and 10 homes selling each month, there is a 5 month supply of homes for sale.
Months of supply is a good indicator of whether a particular real estate market is favouring buyers or sellers.
4- Average prices continued to increase to near record levels. For owner’s of homes, it is satisfying to note that the average home value has increased more than 100% in the past 10 years. Not a bad return on investment if you sold now?

These charts summarize the Year to Date data for Jan.-Mar. 2020. The loudest thing that they say is that March was a strong continuation of the trends outlined above. These trends have been moving less supply and more demand into a continuing rice escalation for some time. Of course, considering that the final 10 days of March was impacted by the pandemic and these numbers are still this strong; it says a lot about how robust the market WANTED to be.
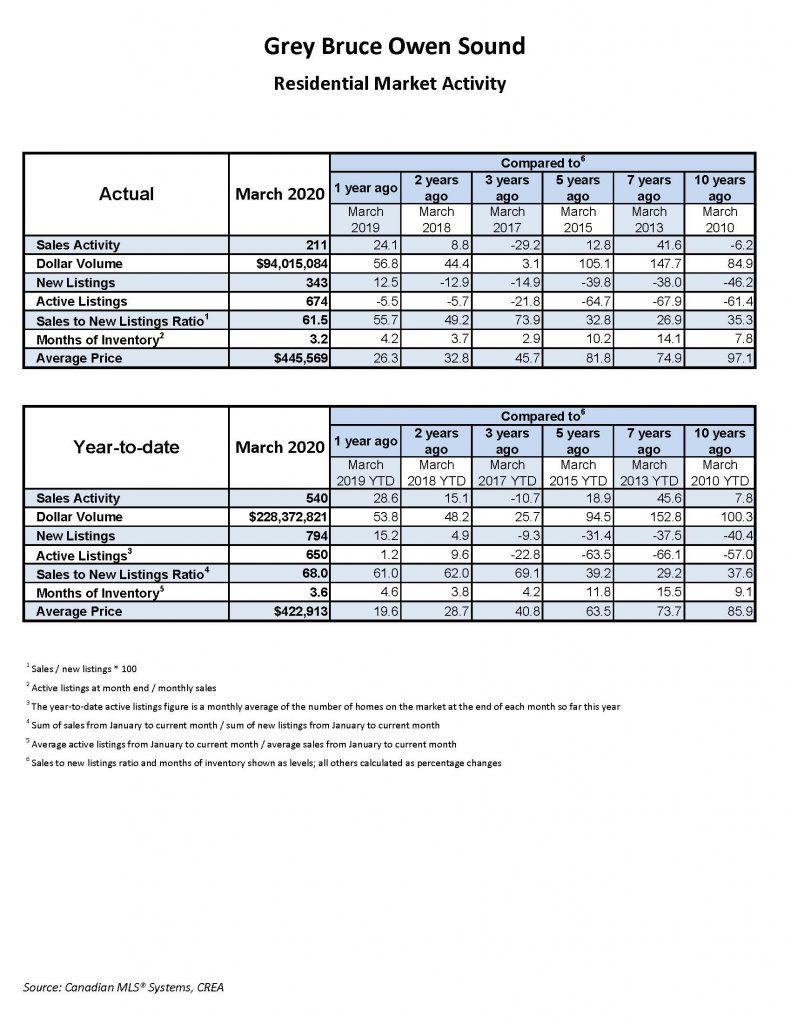
These charts offer the bottom line performance stats. While you can pick out the ones that interest you the most, the ones I find most interesting are:
1- Residential Sales March: set a record high of 211 units (up 24.1% from 2019)
2- Average Price in March: $445,569 (up 26.3% from 2019)
3- YTD Residential Sales: 540 units (up 28.6% from 2019)
4- YTD Average Price: $422,913 (up 19.6% from 2019)
