


KEY POINT SUMMARY:
1- We are now one year away from the peak of the market. As a result, it is a time where time frames such as year over year become more meaningful.
2- The local market declines are more statistically evident.
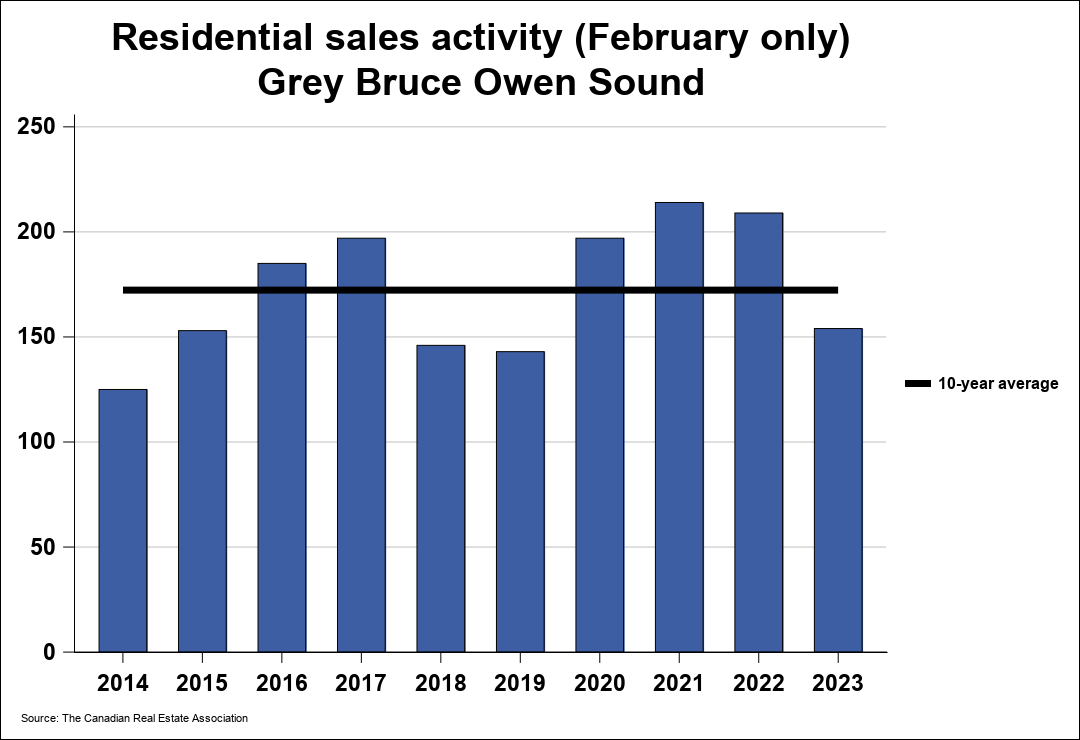
3- Sales activity continues to decrease. Month over month, however, shows signs of rebound.
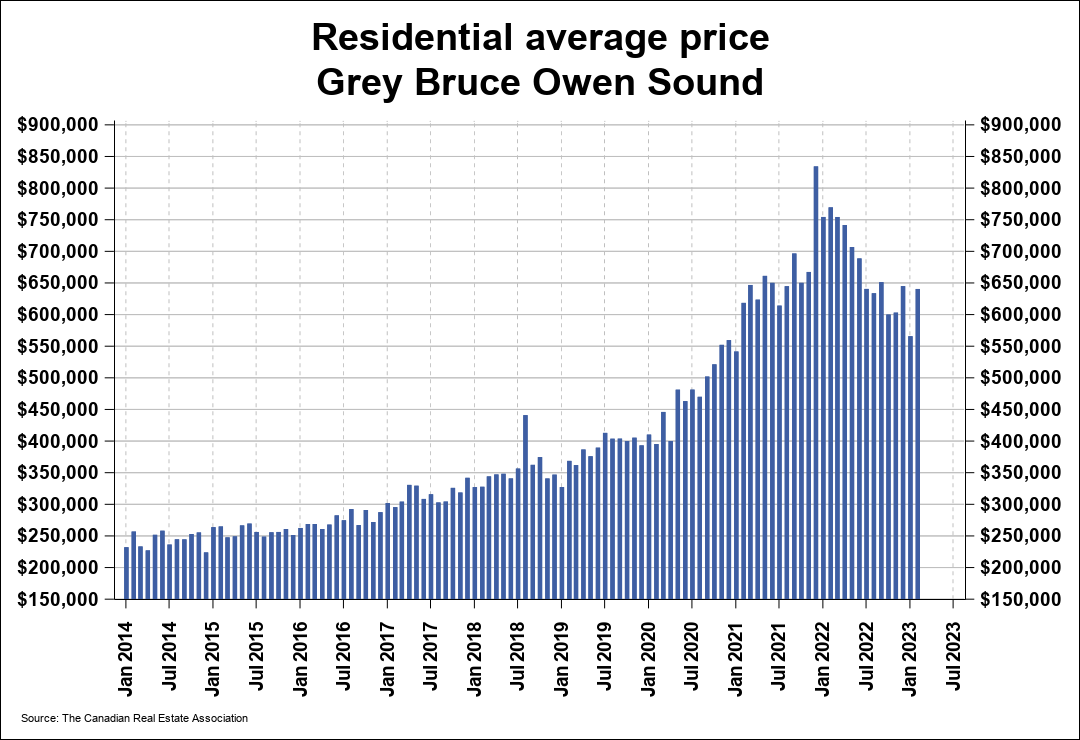
4– Average price trends continue downward.
5- New Listings and Active Listings have increased and may lead to increased impact on the Supply / Demand balance.
6– Months of Inventory has reversed and are now well above the longer term average.
THE DETAIL:
1- HOME SALES (MLS Residential)
a) Year over year (Feb ‘22vs’23): Numbers Sold were down 26.3% from ‘22 (154 units)
b) YEAR TO DATE (YTD): (Jan. 1-Feb.28) down 30.8% (267 units)
c) Five Year Average: Numbers Sold were DOWN 16%
2- AVERAGE PRICE OF SOLD HOMES
a) Feb. ‘23vs’22: The average price of homes sold in February 2023 was $640,482, DOWN by 16.8% from February 2022.
b- YTD: (Jan. 1-Feb. 28) DOWN 20.2% vs 2022 YDT
3- HOME PRICE INDEX (HPI)
The MLS® Home Price Index (HPI) tracks price trends far more accurately than is possible using average or median price measures.
a) Feb. ’23 vs ’22: DOWN 14.7%
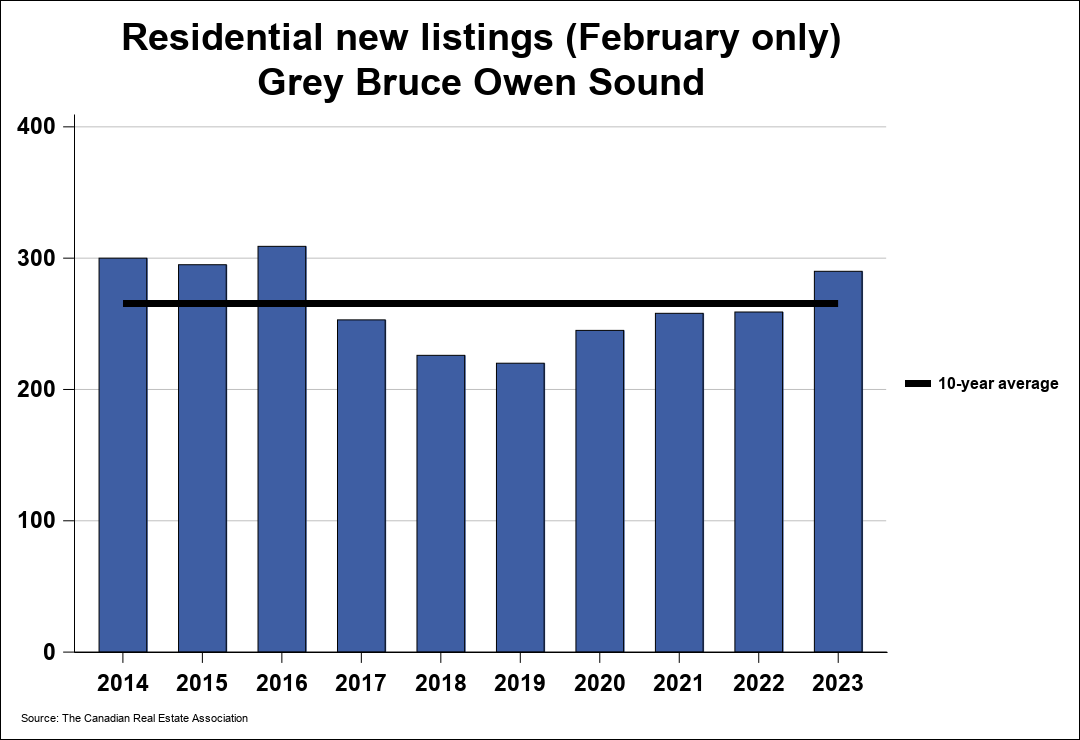
4- NEW LISTINGS
a) Feb. ‘23vs’22: UP 12%. This (290 new listings) was the largest number of new listings added in the month of February in more than five years.
b) Five Year Ave.: The Feb. ’23 were 14% over the 5-year average.
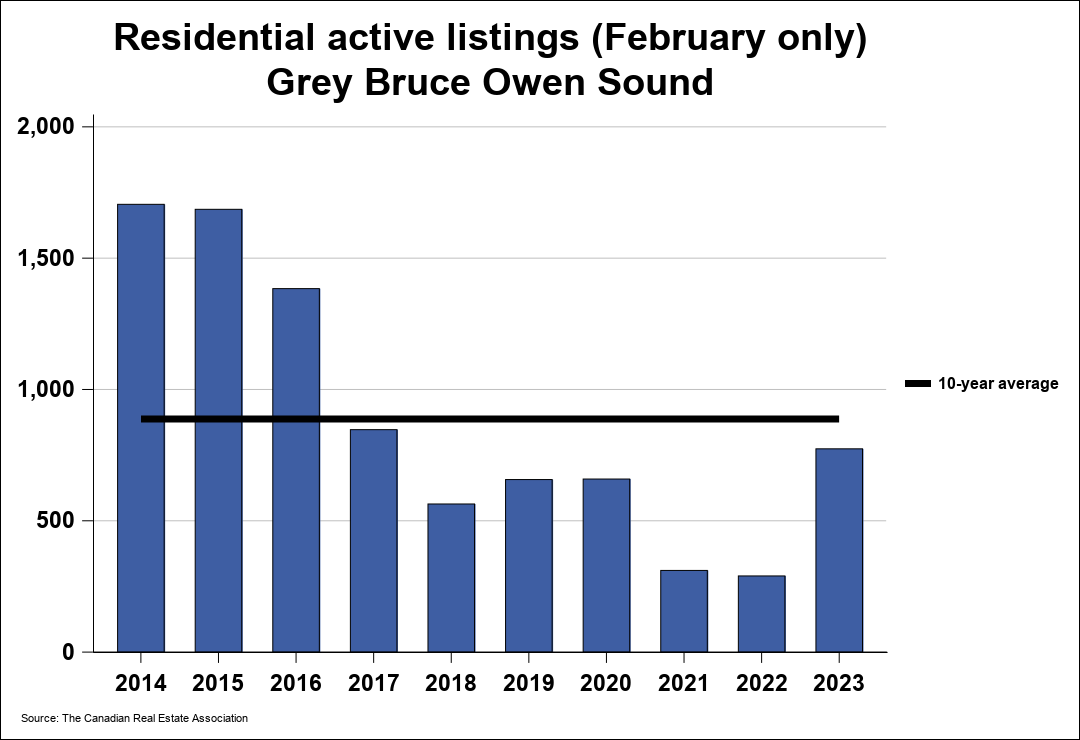
5- ACTIVE LISTINGS
a) YTD: UP 166.9% from 2022
b) Five Year Average: UP 43.8%
6- MONTHS OF INVENTORY
a- Feb. ‘23vs’22: Number 5 at end of Feb. ‘23 VS 1.4 at end of Feb. ‘22
b- Long Run Average for this time of year is 5.6 months.
(The number of months of inventory is the number of months it would take to sell current inventories at the current rate of sales activity.)
