No question. Love it or hate it, the real estate market of 2021 was distinctive.
The following provides some much more local stats than the regional, provincial or national stuff we usually see.
“Local” for this purpose is an area including Saugeen Shores through Kincardine through Huron-Kinloss and from the shoreline inland approx. 10km. The subjects involved are all types of residential properties.
The attachments provide graphic illustration of the Local activity.
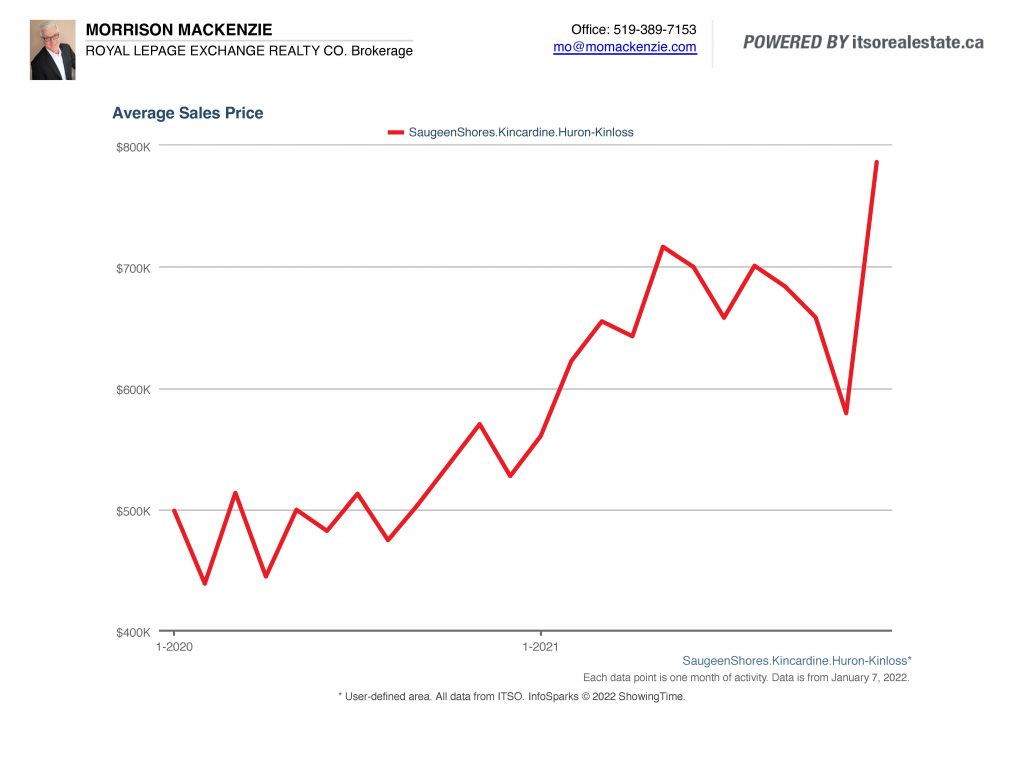
1- Sold Home Price 2021 (AVERAGE): Dec. 2021 sales price ($786,219) was up 49.1% in sold price ($527,345) compared with Dec. 2020.
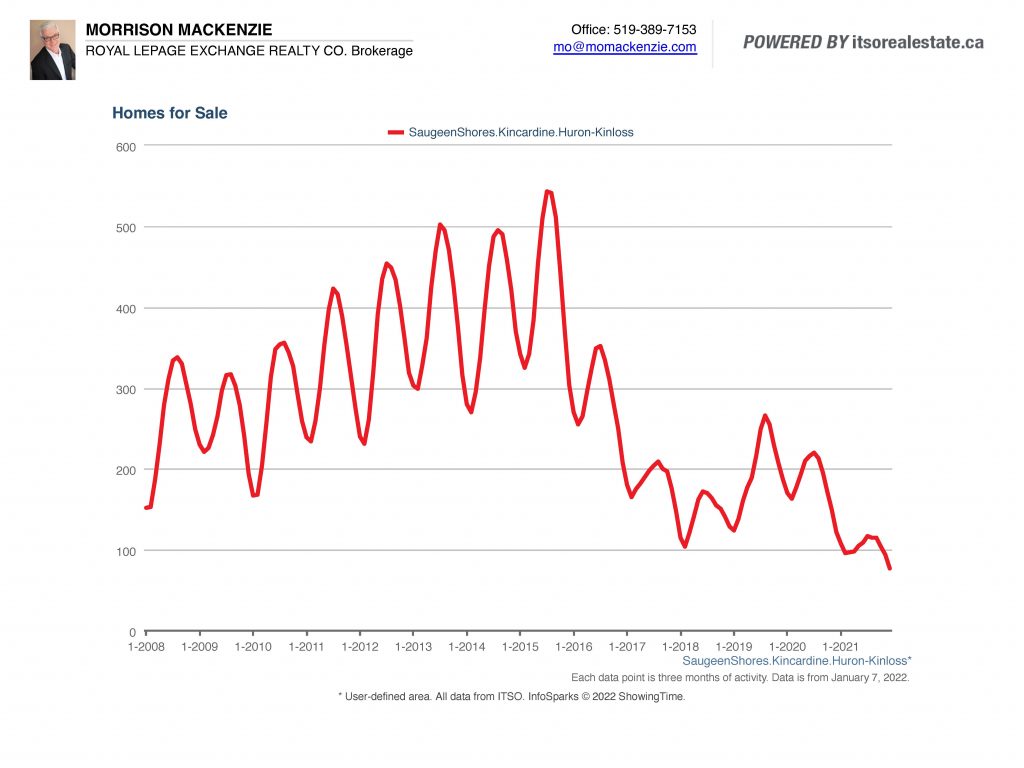
2- Number of Homes for Sale: The 2015 peak (July) was 543 homes. The peak in 2021 (July) was 117. No surprise, huge drop in Supply drives excess Demand. It was clearly a Seller’s market.
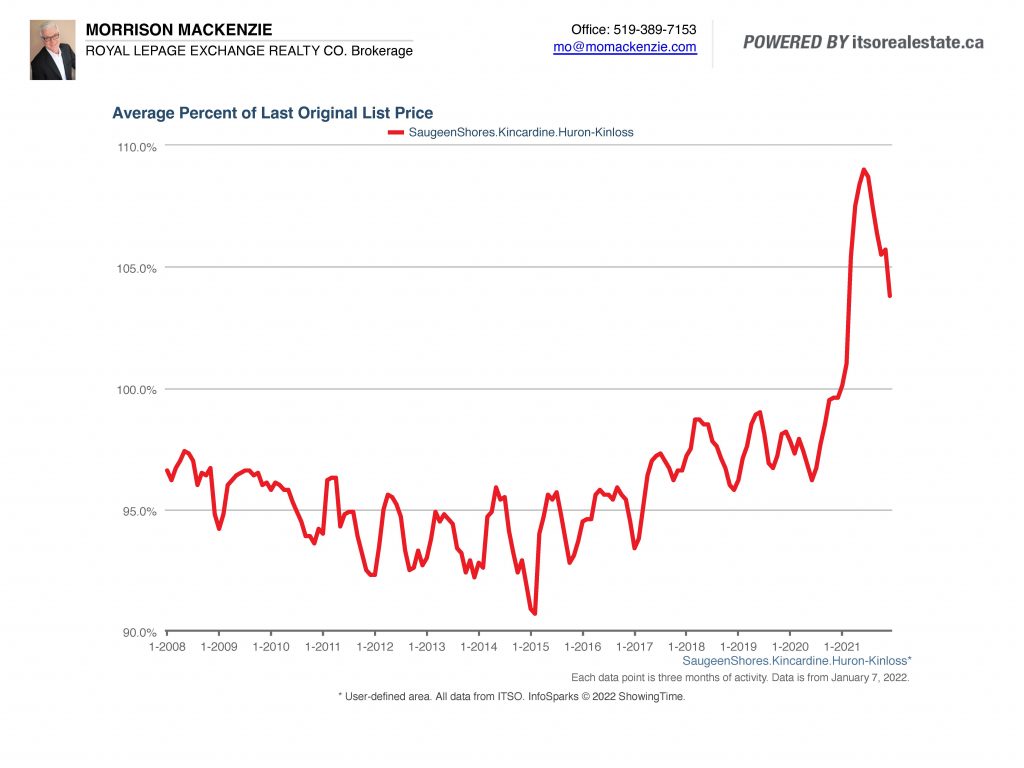
3- Original Price vs the Actual Sold Price (AVERAGE): In Jan. ’21 it was 100%. In June ’21 it was 109%. In December ’21 it was 104%
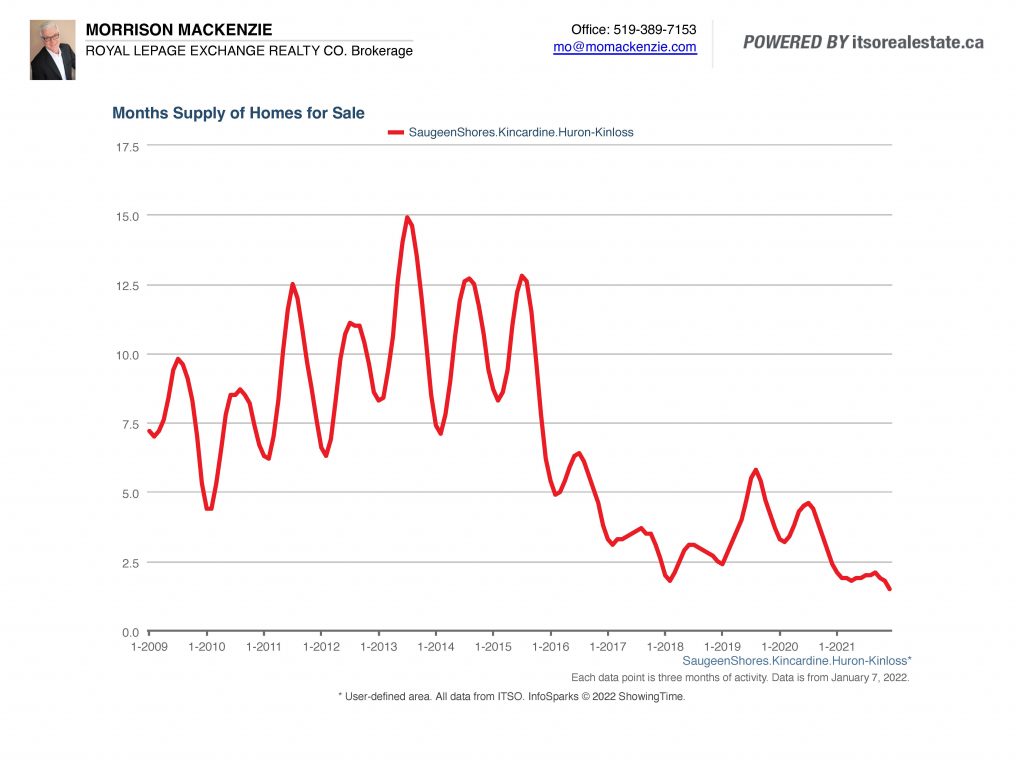
4- Months of Listing Supply: In July 2015 this same area had 14.9 months supply. In July 2021 there was 2 months supply.
I have not included Number of Days to Sell this time because there were too many special sales tactics (like holding offers for a week) that skewed results compared to traditional timeframes. Suffice to say Days on Market were much shorter than usual.
No question, it has been a “much-better-than-good” time to be a Seller!
As usual with these updates, this message is purely for your information purposes. There is no representation of complete accuracy herein. All the data does however, come directly from the Grey Bruce Owen Sound Real Estate Association ITSO Information Technology Systems Ontario data management system.
These numbers are, in my opinion, representative. Remember please though, that every change in criteria will impact the specific numbers. It is always dangerous to generalize too much.
